Most trading track records are marketing. Somebody posts a screenshot of a P&L, and there is no way to know what was cropped out of it.
Kinfo is different in one specific way: it connects a trader's profile to their actual broker account and verifies every trade against it. That turns a claim into a record, and it is the reason this analysis was possible at all — the data is tied to real executions rather than to what somebody says they did.
I came at it from two directions. I work with data for a living, and I run a small algorithmic trading setup of my own. That combination leaves you building strategies constantly and almost never able to check them against somebody who is demonstrably good, because the evidence is usually unverifiable. As a Kinfo member I had access to a board full of records where the evidence is not.
So the question I set out to answer was a simple one: what are the consistently profitable traders on that board actually doing differently — is there a pattern in the timeframes, the structures, the sizing, the way they exit — and is any of it something I could encode and run myself?
To answer it I pulled the complete trade histories of the 23 most profitable verified traders — 216,885 individual trades — through the platform's own API, and recomputed every number from the raw fills rather than reading the summary figures. I found patterns. They were not the ones I expected, and most of them were about the metrics themselves being unreliable rather than about the traders.
How this ranking is weighted
Profit is the wrong question for us. These four axes decide whether a strategy could be rebuilt and run — and they are weighted accordingly.
Credibility
Is the reported profit actually trading? Positions with no cost basis, imported vs live-tracked history, and stock legs that quietly absorb the losses an option win rate advertises away.
Consistency
Does it repeat? Losing months, profitable years, monthly stability, drawdown against profit, and how much rides on the best month, best year and ten biggest trades.
Clarity
Can we see the mechanism? Transparency settings, plus whether an exit rule is actually visible in the fills. We can only rebuild what we can read.
Replicability
Could we run it? The capital implied by median position size and notional, and whether the posture needs a balance sheet this project does not have.
None of this scores skill. jurn is probably the best trader on the board and ranks 11th, because his edge needs $55bn of notional throughput and he holds naked index positions to expiry. Excellent and unreplicable are not contradictory.
Who we would actually trust
Four records survive scrutiny — for different reasons, and with different uses to us.
The best options record on the board. Run at one contract, 86% of shorts closed before expiry at a median 63% of credit. Sells nothing, 45 followers, never made the top 20. We went in expecting to replicate him — that did not survive contact.
The best equity curve at scale. Eight profitable years out of eight, rising throughout. No streak carries it — the best month is 5.8% of lifetime profit. Pure stock day trading; his 28 option trades lost money and he stopped.
Statistically the most consistent record found, and the hardest to explain by luck: 27,958 trades and his ten best are only 2.4% of gross wins — no outlier carries him. He loses on 18% of days and his worst hole is −$125,166, but he fills them in a median of 12 trading days, faster than anyone here.
Credibility 100/100 — zero contamination, the only live-tracked account, no hidden settings, sells nothing, genuinely options-only. The problem is size: a $3.95m drawdown and $5.66m of median notional per leg.
All 23, ranked
Scores are 0–100 per axis. Fake% is the share of reported profit that comes from positions with no purchase price — money that entered the account rather than being earned in it.
| # | Trader | Score | Cred | Cons | Clar | Repl | Reported | Instrument | Yrs + | Losing mo | Fake% | Sells |
|---|---|---|---|---|---|---|---|---|---|---|---|---|
| 01 | onezerozerom | 93.2 | 85 | 95 | 100 | 100 | $1,191,444 | OPT | 7/7 | 18% | 2.7% | — |
| 02 | Kyle Williams | 92.0 | 89 | 100 | 100 | 72 | $10,689,559 | STK | 8/8 | 13% | 0.0% | YES |
| 03 | edu_trades | 88.7 | 90 | 100 | 88 | 65 | $3,757,530 | STK | 8/8 | 8% | 0.0% | YES |
| 04 | daily_harvester | 87.8 | 77 | 90 | 95 | 100 | $743,923 | OPT | 3/3 | 4% | 15.1% | — |
| 05 | KrisVerma | 82.5 | 90 | 81 | 88 | 65 | $3,065,901 | STK | 6/6 | 26% | 0.0% | YES |
| 06 | Gex | 82.1 | 80 | 74 | 86 | 100 | $1,042,158 | OPT | 6/7 | 14% | 0.4% | — |
| 07 | dom | 81.9 | 95 | 64 | 100 | 65 | $1,916,297 | STK | 5/6 | 29% | 0.0% | YES |
| 08 | TctTrader | 80.7 | 86 | 62 | 100 | 80 | $1,834,864 | STK | 7/8 | 33% | 0.0% | — |
| 09 | vette | 79.4 | 67 | 71 | 100 | 100 | $2,696,036 | OPT* | 7/7 | 28% | 16.5% | — |
| 10 | Weekly OPTIONS | 76.4 | 94 | 59 | 86 | 60 | $1,917,812 | OPT | 3/3 | 30% | 0.0% | YES |
| 11 | jurn | 75.0 | 100 | 53 | 95 | 35 | $5,704,957 | OPT | 3/3 | 27% | 0.0% | — |
| 12 | Steven Dux | 74.3 | 87 | 70 | 76 | 50 | $11,772,881 | STK | 9/10 | 25% | 0.0% | YES |
| 13 | Jay Gamma Trader | 73.5 | 91 | 48 | 95 | 60 | $1,804,278 | OPT | 2/3 | 38% | 0.0% | — |
| 14 | blacknugget | 73.3 | 90 | 32 | 100 | 80 | $2,615,164 | STK | 2/3 | 33% | 4.0% | — |
| 15 | Bobdog | 72.1 | 89 | 42 | 71 | 100 | $3,021,211 | OPT | 2/3 | 40% | 4.6% | YES |
| 16 | Aikido Trading Enigma | 70.3 | 88 | 52 | 95 | 38 | $10,309,138 | STK | 6/7 | 37% | 2.8% | YES |
| 17 | Pace | 70.2 | 56 | 56 | 95 | 100 | $1,710,888 | OPT | 5/6 | 31% | 12.3% | YES |
| 18 | Heliomaster | 68.1 | 80 | 63 | 59 | 62 | $10,904,738 | STK | 9/11 | 26% | 0.0% | — |
| 19 | ravenloft | 64.6 | 36 | 58 | 98 | 100 | $2,927,849 | OPT | 4/4 | 12% | 43.7% | — |
| 20 | greenmachine | 62.0 | 91 | 9 | 88 | 65 | $1,655,623 | STK | 5/9 | 49% | 0.0% | — |
| 21 | zanger | 60.4 | 63 | 19 | 95 | 92 | $2,084,488 | OPT | 8/12 | 35% | 9.4% | — |
| 22 | madaz | 55.6 | 80 | 17 | 64 | 65 | $11,328,730 | STK | 6/10 | 40% | 0.0% | YES |
| 23 | NeilStrikes | 42.2 | 30 | 0 | 100 | 78 | $2,724,544 | OPT | 6/13 | 57% | 141.2% | — |
* vette is 53% options by trade count but loses money on them — see below.
What a monthly curve hides — and what it reveals
A correction, prompted from outside. A reader who follows edu_trades pointed out he had reported roughly a $100k loss about four weeks ago — which contradicted the $3,284 max drawdown this page first published. They were right and the table was wrong.
The error was the measurement window, not the data. Drawdown was computed on the monthly curve, where a brutal day is netted against the twenty other days in its month. Every drawdown figure on this page is now measured on the daily curve.
| Trader | Monthly curve | Daily curve | Understated by |
|---|---|---|---|
| edu_trades | −$3,284 | −$125,166 | 38× |
| daily_harvester | −$4,110 | −$35,847 | 8.7× |
| Kyle Williams | −$342,488 | −$516,441 | 1.5× |
| KrisVerma | −$406,658 | −$613,201 | 1.5× |
| jurn | −$2,944,019 | −$3,949,478 | 1.3× |
| onezerozerom | −$66,382 | −$76,805 | 1.2× |
| madaz | −$6,301,873 | −$7,181,342 | 1.1× |
The gap is widest exactly where it matters most — for the high-frequency traders whose monthly totals look serene. Whether that gap is a warning or a compliment is the next question, and the answer turns out to be "both".
What edu_trades actually went through matches the outside report
2026-07-24 — 25 trades, gross losses −$101,360, net for the day −$87,439. Worst single trade: 106,547 shares from $3.8789 to $4.5846, −$76,687. The drawdown deepened to −$125,166 by 2026-07-29 and was still not recovered at the data cutoff.
The "~$100k" is his gross loss on the losing positions that day — the figure a trader naturally quotes — against a net day of −$87,439.
He loses money on 18% of trading days: 315 of 1,763. The "7 losing months in 92" figure was true and, on its own, misleading.
But the ratio is not only an indictment framing corrected
Calling it "understated by 38x" treats the monthly figure as pure error. It is not. A large gap between the two means the holes get filled inside the month — which is a real and favourable property, not an artifact.
July 2026 is the case in point. The loss did not arrive in a vacuum: he was already up $167,612 over the first 23 days. It landed on the 24th, cost $96,859 across the rest of the month, and July still closed at +$70,753.
Read as a recovery-speed measure rather than a risk measure, the ratio ranks him first by a distance. Median trading days to fill a drawdown:
| Trader | Monthly DD | Daily DD | Ratio | Median days to fill |
|---|---|---|---|---|
| edu_trades | −$3,284 | −$125,166 | 38.1× | 12 |
| KrisVerma | −$406,658 | −$613,201 | 1.5× | 23 |
| onezerozerom | −$66,382 | −$76,805 | 1.2× | 24 |
| Kyle Williams | −$342,488 | −$516,441 | 1.5× | 32 |
| jurn | −$2,944,019 | −$3,949,478 | 1.3× | 63 |
| madaz | −$6,301,873 | −$7,181,342 | 1.1× | never |
madaz's deepest drawdowns have no recovery date at all — they were never filled. That is the other end of the same measure.
One caveat on the current episode not yet closed
His six closed drawdowns filled in 5, 8, 16, 17, 16 and 9 trading days. The July one is his deepest and is still open at 22 days — he has clawed back about $80k of the $125k and remains $44,761 below the 23 July peak at the data cutoff. So "he always recovers quickly" is the base rate, not a description of where he is right now.
Which number is right? they answer different questions
Daily answers "how deep is the hole while you are in it" — the number that governs sizing and margin. Monthly answers "does the strategy out-earn its holes" — the number that governs whether the drawdown is survivable. Quoting either alone is what produced the error; this page now carries both.
Does the ranking change? barely
edu_trades stays at #3 with a consistency score of 100, because $125,166 against $3.76m of lifetime profit is still only 3.3% — the tightest drawdown ratio of anyone here. The metric was wrong; the conclusion it supported happened to survive. Composite scores moved under a point and no position changed hands.
The lasting lesson is about method: a smoothing window is a choice that can manufacture the answer. Monthly buckets flattered every high-frequency trader in this study, and would have flattered a strategy of ours the same way. Even daily hides intraday pain — that gross figure is 16% worse than the day's net.
None of this counts against the trader note
The losses are all present in his verified record, he reports them publicly, and the outside account of what he said matches the data to the dollar. A trader who publishes a −$101,360 day is doing the thing that makes a track record worth reading — and it was his own disclosure that caught an error in this analysis.
Where the money actually comes from
The instrument label on the leaderboard is frequently not where the profit is. Each bar splits a trader's lifetime PnL into its option book and everything else. Several of the best records here contain no options whatsoever.
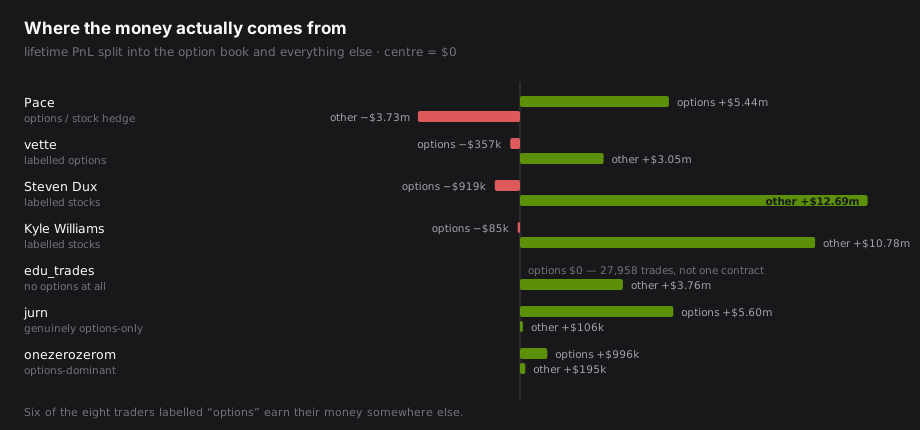
Of the eight traders the first pass called options traders, only jurn and Bobdog make the bulk of their money on options in the way the label implies. And the two most consistent records on the whole board — edu_trades and madaz — never touched a contract: 27,958 and 53,278 trades, all stock.
Inconsistencies found
Seven, ordered by how badly they change the conclusion.
NeilStrikes record inverts
Nine positions carry no purchase price. They are worth $3,848,369 against a reported profit of $2,724,544 — 141%. Excluding them the account is −$1,123,825.
What this does and does not show. The missing cost basis is a fact of the feed, not evidence about the trader: every buy fill on those positions arrives with no price, which is exactly what a transferred-in holding looks like. They may well have been real gains earned elsewhere. The narrower claim is the one that matters — his reported profit is not measuring his trading, and a leaderboard ranking him on it is ranking something else.
Two are 2022 penny-stock positions (226,194 shares sold at $4.61; 146,195 at $4.98); five more cluster on 2025-08-29 and 09-05. His actual options book is roughly flat (+$71,180 across 1,252 option and spread rows). 47 of 82 months losing, and 56.1% of all gross wins come from ten trades.
madaz highest win rate, worst consistency
93.1% of trades win — the best rate on the leaderboard — and losses average 11.5× wins ($17,959 vs $1,564). Worst single loss $1,901,276. Months of −$3.05m, −$2.96m and −$1.82m sit inside a +$6.7m year.
Max drawdown −$6.3m, or 55.6% of lifetime profit. 2022 −$1.05m, 2023 −$81k, 2026 −$105k. The best refutation of win rate as a selection metric we have — and none of it is hidden: every figure here comes from his own published record.
ravenloft 43.7% is account setup
89 rows in April 2024 with no cost basis, worth $1,279,043. Genuine trading is approximately $1.65m, not $2.93m. Separately, 55.9% of net profit comes from a single month.
vette wrong instrument label
Presented as an options trader. His options lose $357,225 and his futures lose $84,838; all $3.05m of profit comes from 275 stock trades. The earlier "607% average gain" flag understated the problem.
zanger ten years imported
The account was created 2025-01-07 and carries trades back to 2015 — 3,631 days of backfill. 44 of 126 months losing, 47.2% of profit in one month, the weakest monthly stability in the set bar madaz and greenmachine.
Only one record was tracked live structural
jurn's account existed before his first trade. Every other record was imported at signup — Steven Dux +1,141 days, vette +1,142, ravenloft +1,261, zanger +3,631, NeilStrikes +4,051. Imported history is not fraud, but it was never observed in real time and the broker feed decides what it contains.
Several headline names are in decline stale edges
Steven Dux 2021 +$3.58m → 2025 +$21k. madaz 2021 +$6.69m → 2026 −$105k. dom 2021 +$1.0m → 2026 −$9k. TctTrader 2020 +$924k → 2024 +$2k. Ranking by all-time profit surfaces people whose edge already stopped working.
Who is actually running a bot
Nobody has to declare automation, so this reads the timestamps instead. Two questions: who says so, and whose execution betrays it regardless. Three of the 23 show execution a human cannot produce, and two of those three say nothing about it on their profile. Nothing on Kinfo asks them to — this is an observation about how the trades were placed, not an accusation of concealment.
The three that are systematic
Confirmed bot, openly declared — the account is literally named "Algo account". 48.7% of 6,768 trades fire within 3 seconds of a :00 or :30 boundary, across 37 slots. A half-hourly timer loop.
Very likely a bot; his profile does not mention it. 52.9% of entries land on the quarter-hour grid against 6.7% expected. Not feed rounding: those :00-second rows appear in only 21 of 60 minutes.
Partly automated; his profile does not mention it. Baskets of up to 15 different stocks bought inside 2 seconds with computed odd share counts (33, 78, 86, 129…). Nobody types that. Alongside a much larger discretionary block book.
And the one we checked for the opposite reason
onezerozerom is discretionary the answer cuts both ways
We ran him through the same test hoping to find machinery worth copying. There is none: schedule 0.9%, and his same-second clusters collapse to 13 across 5,462 trades. The 76% one-contract sizing and 86% managed exits are a rule he follows by hand.
That reads as good news — no black box we would fail to reproduce. It is also the problem. A hand-followed habit is not an algorithm, and when we went looking for the actual thresholds, they were not there. See below.
Two traps that manufacture false positives
Placeholder timestamps corrected mid-analysis
Kinfo stamps 00:00:00, or 04:00:00 / 05:00:00 (the same midnight-ET marker either side of DST), when the broker gave a date but no clock. Some feeds use their own — edu_trades has 16:00:00 on 11.7% of rows.
The first run read those as executions and ranked Pace, Bobdog, NeilStrikes and edu_trades as "partly systematic" on nothing but missing data. All four are discretionary once the markers are dropped.
But a repeated time is not automatically a placeholder — a bot fires on a grid. Discarding every frequent timestamp deleted Naoufel's entire signature. The rule now keeps times that have siblings at other slots on the same regular grid.
Multi-leg option tickets corrected mid-analysis
Kinfo splits a spread into one row per leg, all sharing an entry second. That read as basket firing and made Jay Gamma Trader look 65% automated.
Restricting the test to clusters spanning different underlyings collapsed his 2,295 same-second clusters to 16. He places multi-leg tickets; he does not fire baskets.
What the declared algo traders actually earn
19 of 1,005 profiles mention automation. The best ranks 40th, and the tail is negative.
| Rank | Trader | Profit | Trades | How they describe it |
|---|---|---|---|---|
| 40 | TQQQTrader | $887,805 | 358 | Systematic TQQQ and SQQQ trader |
| 87 | Naoufel Taief | $269,523 | 6,768 | Algo account |
| 125 | stonk_surfer | $155,511 | 8,621 | implementing python scripts |
| 149 | YankeeAxelrod | $116,548 | 1,974 | All trades taken are done via algo |
| 158 | Sharpely TOS | $107,864 | 621 | Systematic multi-strategy |
| 300 | pb0316 | $19,430 | 1,461 | Quantitative, Statistics, Mechanics driven |
| 489 | co_trading | $41 | 997 | Trader 100% algorítmico, 7 años |
| 971 | ai-trader-pro | −$113,438 | 1,577 | — |
| 995 | SADM Capital | −$329,542 | 3,030 | systematic options trader, CFA |
TQQQTrader does not survive a closer look either: 67.2% of his gross wins come from ten trades, 82% of profit from one year, 61% of days losing, and a drawdown worth 47.5% of lifetime profit — across only 358 trades. He also carries no intraday timestamps at all, so the systematic claim cannot be checked against execution.
The read: automation is not the edge on this platform. The top of the board is discretionary traders — plus two who are quietly systematic and don't advertise it. And the one we want to replicate does it by hand, which means the rule is simple enough to state and there is nothing hidden we would fail to rebuild. What we would add is the automation he never bothered with.
Caveat: absence of a signal is not proof of a human. A bot that adds jitter, or trades only on events, leaves no grid. This finds lazy automation — which is most of it.
The most consistent — three answers
The honest answer depends on what "consistent" is being asked to mean.
92 months, seven losing — six of them in 2019 while starting out, the seventh −$3,284 net. Median month +$31,321.
- Max drawdown $125,166 on $3.76m — 3.3%
- Top ten trades: 2.4% of gross wins — next best is 8.6%
- 27,958 trades · avg win $433 · avg loss $662
- Small-cap intraday scalping, sub-day holds
Eight profitable years out of eight and rising: $39k → $609k → $1.87m → $1.01m → $1.10m → $1.97m → $2.19m → $1.91m.
- 12 losing months in 89
- Best month 5.8% of profit, best year 20.4%
- Max drawdown $516,441 on $10.7m — 4.8%
- Pure stock, median hold 0 days, 8,000 shares
Seven profitable years out of seven, 11 losing months in 62 — and unlike the other two it is an options book. Whether we could run it is a separate question, answered below.
- Median size one contract, $16,500 notional
- 45–75 DTE, best cohort 93.3% win
- 86% of shorts closed early at median 63% of credit
- Max drawdown $76,805 — 6.4% of profit
What changed when we went deeper on onezerozerom
The ranking put him first and scored his replicability 100/100. Then three things landed, and two of them contradict that score. The record stands; the plan built on it did not.
His exit rule does not exist the one we most wanted
An earlier pass recorded "closes at a median 63% of credit" and left the precise rule open. It is now closed, negatively. Credit captured on winners closed early, in 10% bins:
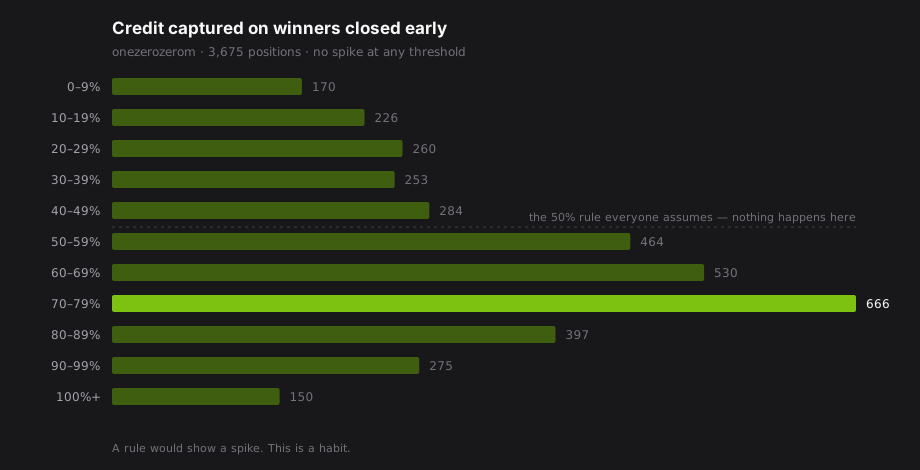
A broad hump with a long tail through zero and into negative. No spike at any threshold — not 50%, not 65%. And it is not a time rule either: cross-tabbed against days remaining, the median capture slides from 53% with 30+ DTE left to 85% with 4–7 left. There is no number to encode.
His entry rule is not in the data either unknowable from here
145 underlyings, a flat weekday distribution, DTE spread from 35 to 70 days, and a credit-to-notional ratio running from 0.02% to 4.91%. Nothing in the record says why he opened that strike on that day. Kinfo has no messaging, so we cannot ask.
Our broker will not place a third of his book checked, not assumed
Alpaca has no naked-option level. Shorts must be covered, cash-secured, or a defined-risk spread leg. 31% of his legs are naked short calls — impossible at any level. His median position needs $9,700 of collateral. On a small retail options budget — take $1,000 as the illustration — only 28% of his positions fit at all.
Which means the replicability score of 100 this page gave him was measuring the wrong thing: capital efficiency in the abstract — one contract, $16,500 notional — rather than what a broker will actually accept. A fourth correction for the list.
So what survives an envelope, not an algorithm
Transfers: 45–75 DTE at entry (his best cohort — 1,690 legs, 93.3% win, +$553k), liquid large-cap underlyings, both sides with a put lean, one contract, close before expiry rather than letting it run, cut losers.
Does not transfer: the naked exposure, which becomes a ~$5-wide vertical — collateral drops to roughly $500 and fits, but the credit is capped too, so his P&L stops applying and the backtest defines the expectation. The short-call half either goes or becomes call verticals. And the profit target is ours to choose: his data supports somewhere in the 50–75% band and says nothing sharper.
The honest summary: he is still the best options record on this board and the ranking is unchanged. What changed is what we thought we were getting from him. We were looking for a mechanism and found a habit — and a habit does not port to a broker that forbids half of it.
What we take from this
onezerozerom is the best record and still not a strategy we can take. It beat 19 traders with more profit on consistency and integrity. But his thresholds are not in the data and our broker will not place a third of his book, so what transfers is an envelope we would have to finish ourselves.
The best-in-class benchmark is stock, not options. Kyle Williams and edu_trades run tighter equity curves than every options trader here. Worth knowing we are choosing the harder instrument.
Win rate is refuted twice over. madaz at 93.1% ranks 22nd of 23, and jurn's highest-win-rate DTE bucket is his only losing one. Do not select or optimise on it.
Consolidate instrument legs before believing any number. Six of the eight nominal options traders make their money somewhere other than options.
Filter the leaderboard before using it as a funnel. No-cost-basis rows, imported history and decaying edges make all-time profit a poor selection signal — it is how the first pass missed onezerozerom and surfaced NeilStrikes.